A spatial dataset containing 453 major African cities (population > 100,000) and international ports. Cities are deduplicated within 50-100km radii, with populations aggregated from nearby settlements. Port cities include cargo flow data from the World Bank Global Ports dataset.
Usage
data(africa_cities_ports)Format
A Simple feature collection (sf object, also inheriting from data.table) with 453 POINT features and 12 fields:
- city_country
Character. Unique city-country identifier (e.g., "Cairo - Egypt", "Lagos - Nigeria").
- city
Character. City name.
- country
Character. Country name.
- iso2
Character. ISO 3166-1 alpha-2 country code.
- iso3
Character. ISO 3166-1 alpha-3 country code.
- admin_name
Character. Administrative region or province name.
- capital
Character. Capital status: "" (none), "admin" (administrative), "minor", or "primary" (national capital).
- population
Numeric. City population including nearby settlements within 30km.
- port_locode
Character. UN/LOCODE port identifier (empty string for non-port cities).
- port_name
Character. Official port name (empty string for non-port cities).
- port_status
Character. Port status code (empty string for non-port cities).
- outflows
Numeric. Outflows in TEU in Q1 of 2020 (NA for non-port cities). 51 cities have port outflow data.
- geometry
POINT. Spatial geometry in WGS 84 (EPSG:4326) coordinate reference system.
Source
City data from Simplemaps World Cities Database (https://simplemaps.com/data/world-cities). Port data from World Bank Global International Ports dataset (https://datacatalog.worldbank.org/search/dataset/0038118/global-international-ports).
Dataset constructed for: Krantz, S. (2024). Optimal Investments in Africa's Road Network. Policy Research Working Paper 10893. World Bank. doi:10.1596/1813-9450-10893 . Replication materials: https://github.com/SebKrantz/OptimalAfricanRoads.
Details
The dataset was constructed by:
Selecting cities with population > 50,000 from Simplemaps World Cities database
Weighting by administrative importance (capital status)
Deduplicating within 50-100km radii, keeping largest weighted city
Aggregating populations from settlements within 30km
Matching with World Bank international ports within 30km
The bounding box spans from approximately 34S to 37N latitude and 17W to 49E longitude, covering continental Africa.
Examples
library(sf)
#> Linking to GEOS 3.12.1, GDAL 3.8.4, PROJ 9.4.0; sf_use_s2() is TRUE
data(africa_cities_ports)
head(africa_cities_ports)
#> Simple feature collection with 6 features and 12 fields
#> Geometry type: POINT
#> Dimension: XY
#> Bounding box: xmin: 3.3841 ymin: -26.2044 xmax: 39.2803 ymax: 30.0444
#> Geodetic CRS: WGS 84
#> city_country city country iso2 iso3
#> 1 Cairo - Egypt Cairo Egypt EG EGY
#> 2 Lagos - Nigeria Lagos Nigeria NG NGA
#> 3 Kinshasa - Congo (Kinshasa) Kinshasa Congo (Kinshasa) CD COD
#> 4 Luanda - Angola Luanda Angola AO AGO
#> 5 Johannesburg - South Africa Johannesburg South Africa ZA ZAF
#> 6 Dar es Salaam - Tanzania Dar es Salaam Tanzania TZ TZA
#> admin_name capital population port_locode port_name port_status
#> 1 Al Qahirah primary 28621082
#> 2 Lagos minor 19932062 NGAPP Apapa QQ
#> 3 Kinshasa primary 16579488
#> 4 Luanda primary 12376210 AOLAD Luanda AI
#> 5 Gauteng admin 12282763
#> 6 Dar es Salaam admin 9048912 TZDAR Dar es Salaam AI
#> outflows geometry
#> 1 NA POINT (31.2358 30.0444)
#> 2 3749556 POINT (3.3841 6.455)
#> 3 NA POINT (15.3119 -4.3219)
#> 4 2439605 POINT (13.2344 -8.8383)
#> 5 NA POINT (28.0456 -26.2044)
#> 6 1404404 POINT (39.2803 -6.8161)
# View largest cities
largest <- africa_cities_ports[order(-africa_cities_ports$population), ]
largest[1:10, c("city", "country", "population")]
#> Simple feature collection with 10 features and 3 fields
#> Geometry type: POINT
#> Dimension: XY
#> Bounding box: xmin: -4.0333 ymin: -26.2044 xmax: 39.2803 ymax: 30.0444
#> Geodetic CRS: WGS 84
#> city country population geometry
#> 1 Cairo Egypt 28621082 POINT (31.2358 30.0444)
#> 2 Lagos Nigeria 19932062 POINT (3.3841 6.455)
#> 3 Kinshasa Congo (Kinshasa) 16579488 POINT (15.3119 -4.3219)
#> 4 Luanda Angola 12376210 POINT (13.2344 -8.8383)
#> 5 Johannesburg South Africa 12282763 POINT (28.0456 -26.2044)
#> 7 Khartoum Sudan 11610745 POINT (32.5 15.6)
#> 6 Dar es Salaam Tanzania 9048912 POINT (39.2803 -6.8161)
#> 10 Abidjan Cote d'Ivoire 9022419 POINT (-4.0333 5.3167)
#> 17 Kumasi Ghana 6898949 POINT (-1.625 6.7)
#> 9 Nairobi Kenya 6527382 POINT (36.8172 -1.2864)
# Filter port cities
ports <- africa_cities_ports[!is.na(africa_cities_ports$port_locode), ]
nrow(ports) # 51 ports
#> [1] 453
# \donttest{
plot(africa_cities_ports["population"])
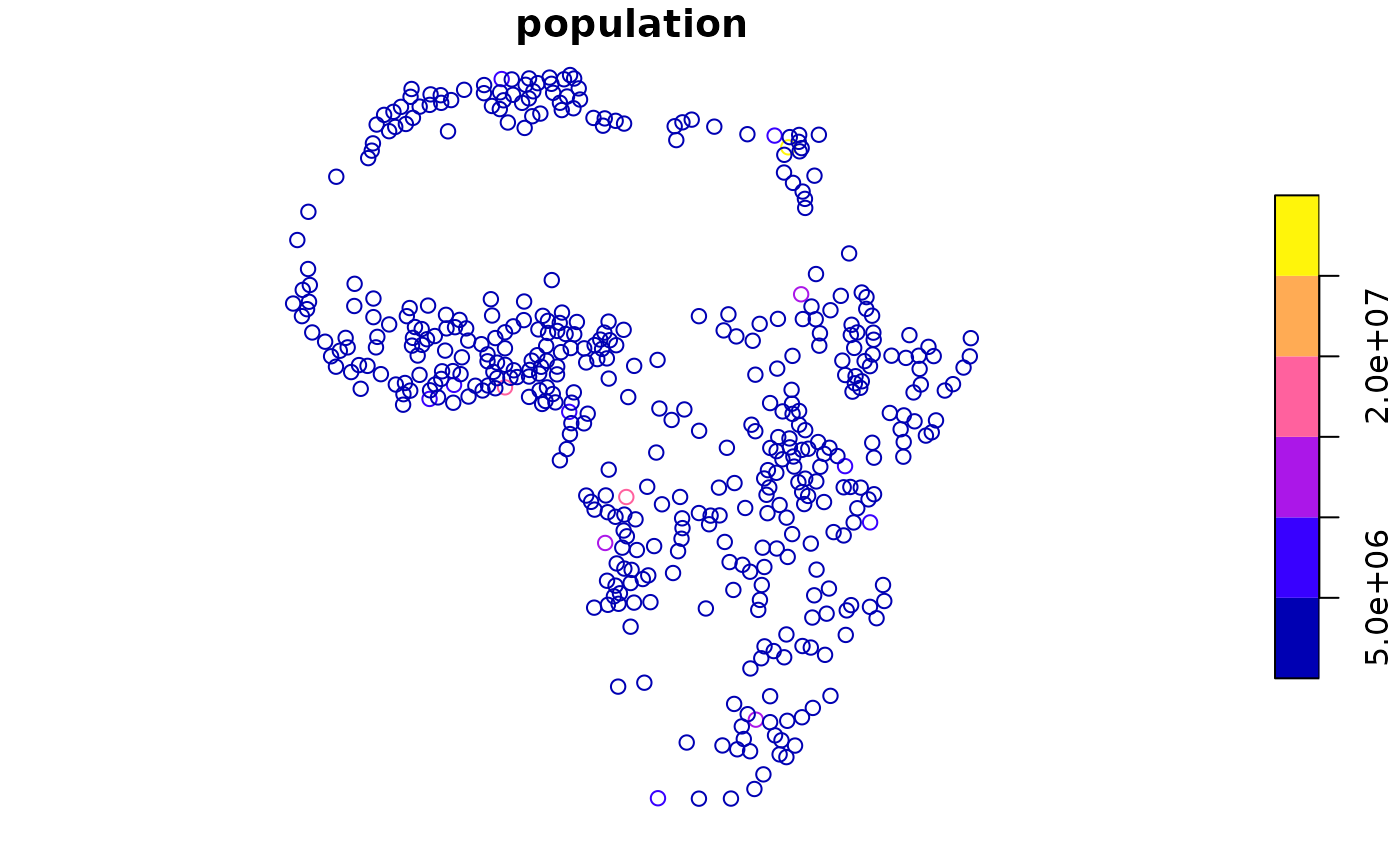 # }
# }