Matrix / Array from Panel Series
psmat.Rdpsmat efficiently expands a panel-vector or 'indexed_series' ('pseries') into a matrix. If a data frame or 'indexed_frame' ('pdata.frame') is passed, psmat returns a 3D array or a list of matrices.
Usage
psmat(x, ...)

# Default S3 method
psmat(x, g, t = NULL, transpose = FALSE, fill = NULL, ...)

# S3 method for class 'data.frame'
psmat(x, by, t = NULL, cols = NULL, transpose = FALSE, fill = NULL, array = TRUE, ...)

# Methods for indexed data / compatibility with plm:

# S3 method for class 'pseries'
psmat(x, transpose = FALSE, fill = NULL, drop.index.levels = "none", ...)

# S3 method for class 'pdata.frame'
psmat(x, cols = NULL, transpose = FALSE, fill = NULL, array = TRUE,
      drop.index.levels = "none", ...)


# S3 method for class 'psmat'
plot(x, legend = FALSE, colours = legend, labs = NULL, grid = FALSE, ...)
Arguments
- x
a vector, indexed series 'indexed_series' ('pseries'), data frame or 'indexed_frame' ('pdata.frame').
- g
a factor,
GRPobject, atomic vector (internally converted to factor) or a list of vectors / factors (internally converted to aGRPobject) used to groupx. If the panel is balanced an integer indicating the number of groups can also be supplied. See Examples.- by
data.frame method: Same input as
g, but also allows one- or two-sided formulas using the variables inx, i.e.~ idvarorvar1 + var2 ~ idvar1 + idvar2.- t
same inputs as
g/by, to indicate the time-variable(s) or second identifier(s).gandttogether should fully identify the panel. Ift = NULL, the data is assumed sorted andseq_colis used to generate rownames for the output matrix.- cols
data.frame method: Select columns using a function, column names, indices or a logical vector. Note:
colsis ignored if a two-sided formula is passed toby.- transpose
logical.
TRUEgenerates the matrix such thatg/by -> columns, t -> rows. Default isg/by -> rows, t -> columns.- fill
element to fill empty slots of matrix / array if panel is unbalanced.
NULLwill generate aNAof the right type.- array
data.frame / pdata.frame methods: logical.
TRUEreturns a 3D array (if just one column is selected a matrix is returned).FALSEreturns a list of matrices.- drop.index.levels
character. Either
"id","time","all"or"none". See indexing.- ...
arguments to be passed to or from other methods, or for the plot method additional arguments passed to
ts.plot.- legend
logical. Automatically create a legend of panel-groups.
- colours
either
TRUEto automatically colour by panel-groups usingrainbowor a character vector of colours matching the number of panel-groups (series).- labs
character. Provide a character-vector of variable labels / series titles when plotting an array.
- grid
logical. Calls
gridto draw gridlines on the plot.
Details
If n > 2 index variables are attached to an indexed series or frame, the first n-1 variables in the index are interacted.
Value
A matrix or 3D array containing the data in x, where by default the rows constitute the groups-ids (g/by) and the columns the time variable or individual ids (t). 3D arrays contain the variables in the 3rd dimension. The objects have a class 'psmat', and also a 'transpose' attribute indicating whether transpose = TRUE.
Note
The pdata.frame method only works for properly subsetted objects of class 'pdata.frame'. A list of 'pseries' won't work. There also exist simple aperm and [ (subset) methods for 'psmat' objects. These differ from the default methods only by keeping the class and the 'transpose' attribute.
Examples
## World Development Panel Data
head(wlddev) # View data
#> country iso3c date year decade region income OECD PCGDP
#> 1 Afghanistan AFG 1961-01-01 1960 1960 South Asia Low income FALSE NA
#> 2 Afghanistan AFG 1962-01-01 1961 1960 South Asia Low income FALSE NA
#> 3 Afghanistan AFG 1963-01-01 1962 1960 South Asia Low income FALSE NA
#> 4 Afghanistan AFG 1964-01-01 1963 1960 South Asia Low income FALSE NA
#> 5 Afghanistan AFG 1965-01-01 1964 1960 South Asia Low income FALSE NA
#> LIFEEX GINI ODA POP
#> 1 32.446 NA 116769997 8996973
#> 2 32.962 NA 232080002 9169410
#> 3 33.471 NA 112839996 9351441
#> 4 33.971 NA 237720001 9543205
#> 5 34.463 NA 295920013 9744781
#> [ reached 'max' / getOption("max.print") -- omitted 1 rows ]
qsu(wlddev, pid = ~ iso3c, cols = 9:12, vlabels = TRUE) # Sumarizing data
#> , , PCGDP: GDP per capita (constant 2010 US$)
#>
#> N/T Mean SD Min Max
#> Overall 9470 12048.778 19077.6416 132.0776 196061.417
#> Between 206 12962.6054 20189.9007 253.1886 141200.38
#> Within 45.9709 12048.778 6723.6808 -33504.8721 76767.5254
#>
#> , , LIFEEX: Life expectancy at birth, total (years)
#>
#> N/T Mean SD Min Max
#> Overall 11670 64.2963 11.4764 18.907 85.4171
#> Between 207 64.9537 9.8936 40.9663 85.4171
#> Within 56.3768 64.2963 6.0842 32.9068 84.4198
#>
#> , , GINI: Gini index (World Bank estimate)
#>
#> N/T Mean SD Min Max
#> Overall 1744 38.5341 9.2006 20.7 65.8
#> Between 167 39.4233 8.1356 24.8667 61.7143
#> Within 10.4431 38.5341 2.9277 25.3917 55.3591
#>
#> , , ODA: Net official development assistance and official aid received (constant 2018 US$)
#>
#> N/T Mean SD Min Max
#> Overall 8608 454'720131 868'712654 -997'679993 2.56715605e+10
#> Between 178 439'168412 569'049959 468717.916 3.62337432e+09
#> Within 48.3596 454'720131 650'709624 -2.44379420e+09 2.45610972e+10
#>
str(psmat(wlddev$PCGDP, wlddev$iso3c, wlddev$year)) # Generating matrix of GDP
#> 'psmat' num [1:216, 1:61] NA NA NA NA NA ...
#> - attr(*, "dimnames")=List of 2
#> ..$ : chr [1:216] "ABW" "AFG" "AGO" "ALB" ...
#> ..$ : chr [1:61] "1960" "1961" "1962" "1963" ...
#> - attr(*, "transpose")= logi FALSE
r <- psmat(wlddev, PCGDP ~ iso3c, ~ year) # Same thing using data.frame method
plot(r, main = vlabels(wlddev)[9], xlab = "Year") # Plot the matrix
 str(r) # See srructure
#> 'psmat' num [1:216, 1:61] NA NA NA NA NA ...
#> - attr(*, "dimnames")=List of 2
#> ..$ : chr [1:216] "ABW" "AFG" "AGO" "ALB" ...
#> ..$ : chr [1:61] "1960" "1961" "1962" "1963" ...
#> - attr(*, "transpose")= logi FALSE
str(psmat(wlddev$PCGDP, wlddev$iso3c)) # The Data is sorted, could omit t
#> 'psmat' num [1:216, 1:61] NA NA NA NA NA ...
#> - attr(*, "dimnames")=List of 2
#> ..$ : chr [1:216] "ABW" "AFG" "AGO" "ALB" ...
#> ..$ : chr [1:61] "1" "2" "3" "4" ...
#> - attr(*, "transpose")= logi FALSE
str(psmat(wlddev$PCGDP, 216)) # This panel is also balanced, so
#> num [1:216, 1:61] NA NA 2481 NA NA ...
#> - attr(*, "dimnames")=List of 2
#> ..$ : chr [1:216] "GRP.1" "GRP.2" "GRP.3" "GRP.4" ...
#> ..$ : chr [1:61] "1" "2" "3" "4" ...
# ..indicating the number of groups would be sufficient to obtain a matrix
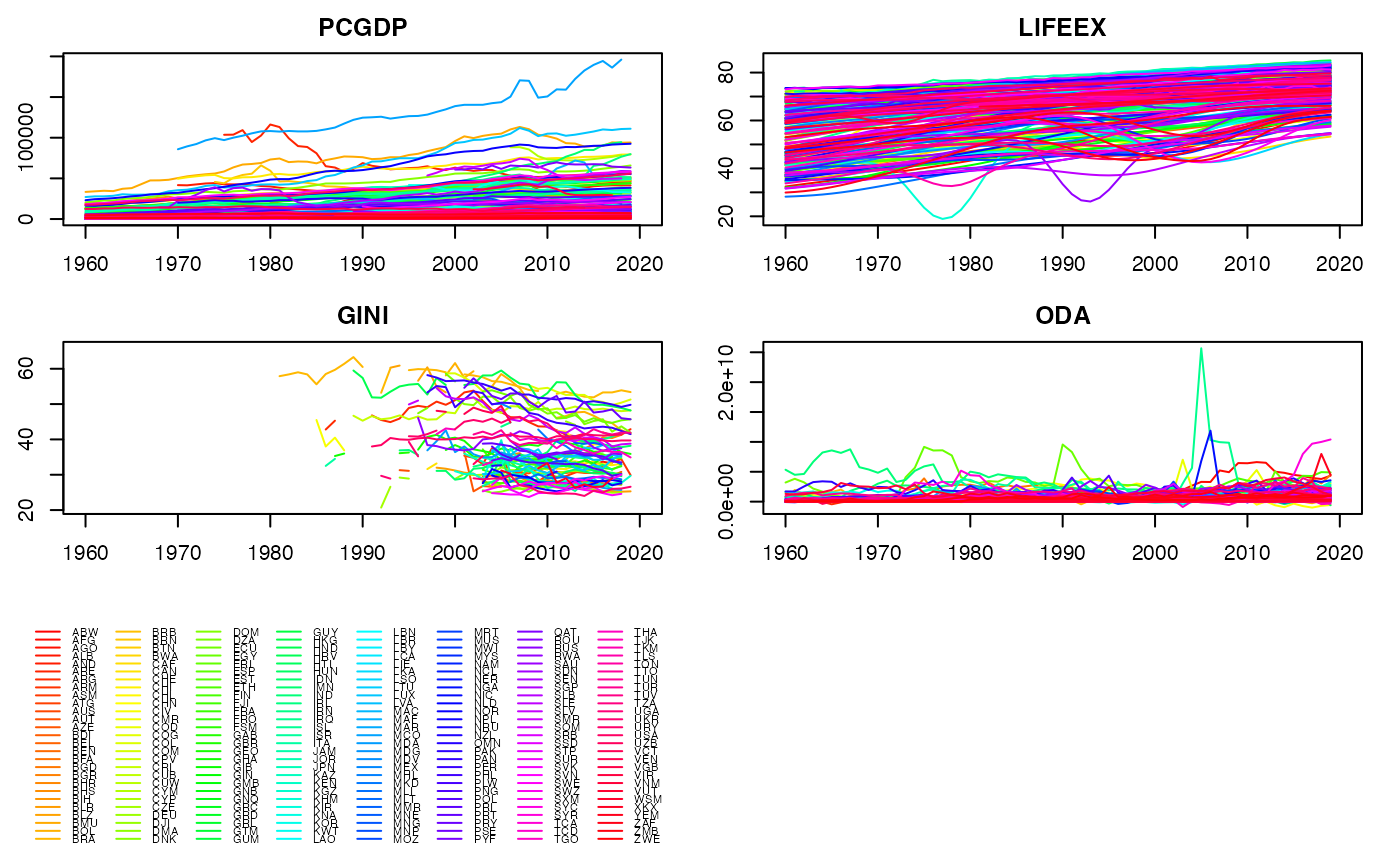
ar <- psmat(wlddev, ~ iso3c, ~ year, 9:12) # Get array of transposed matrices
str(ar)
#> 'psmat' num [1:216, 1:61, 1:4] NA NA NA NA NA ...
#> - attr(*, "dimnames")=List of 3
#> ..$ : chr [1:216] "ABW" "AFG" "AGO" "ALB" ...
#> ..$ : chr [1:61] "1960" "1961" "1962" "1963" ...
#> ..$ : chr [1:4] "PCGDP" "LIFEEX" "GINI" "ODA"
#> - attr(*, "transpose")= logi FALSE
plot(ar)
str(r) # See srructure
#> 'psmat' num [1:216, 1:61] NA NA NA NA NA ...
#> - attr(*, "dimnames")=List of 2
#> ..$ : chr [1:216] "ABW" "AFG" "AGO" "ALB" ...
#> ..$ : chr [1:61] "1960" "1961" "1962" "1963" ...
#> - attr(*, "transpose")= logi FALSE
str(psmat(wlddev$PCGDP, wlddev$iso3c)) # The Data is sorted, could omit t
#> 'psmat' num [1:216, 1:61] NA NA NA NA NA ...
#> - attr(*, "dimnames")=List of 2
#> ..$ : chr [1:216] "ABW" "AFG" "AGO" "ALB" ...
#> ..$ : chr [1:61] "1" "2" "3" "4" ...
#> - attr(*, "transpose")= logi FALSE
str(psmat(wlddev$PCGDP, 216)) # This panel is also balanced, so
#> num [1:216, 1:61] NA NA 2481 NA NA ...
#> - attr(*, "dimnames")=List of 2
#> ..$ : chr [1:216] "GRP.1" "GRP.2" "GRP.3" "GRP.4" ...
#> ..$ : chr [1:61] "1" "2" "3" "4" ...
# ..indicating the number of groups would be sufficient to obtain a matrix
ar <- psmat(wlddev, ~ iso3c, ~ year, 9:12) # Get array of transposed matrices
str(ar)
#> 'psmat' num [1:216, 1:61, 1:4] NA NA NA NA NA ...
#> - attr(*, "dimnames")=List of 3
#> ..$ : chr [1:216] "ABW" "AFG" "AGO" "ALB" ...
#> ..$ : chr [1:61] "1960" "1961" "1962" "1963" ...
#> ..$ : chr [1:4] "PCGDP" "LIFEEX" "GINI" "ODA"
#> - attr(*, "transpose")= logi FALSE
plot(ar)
 plot(ar, legend = TRUE)
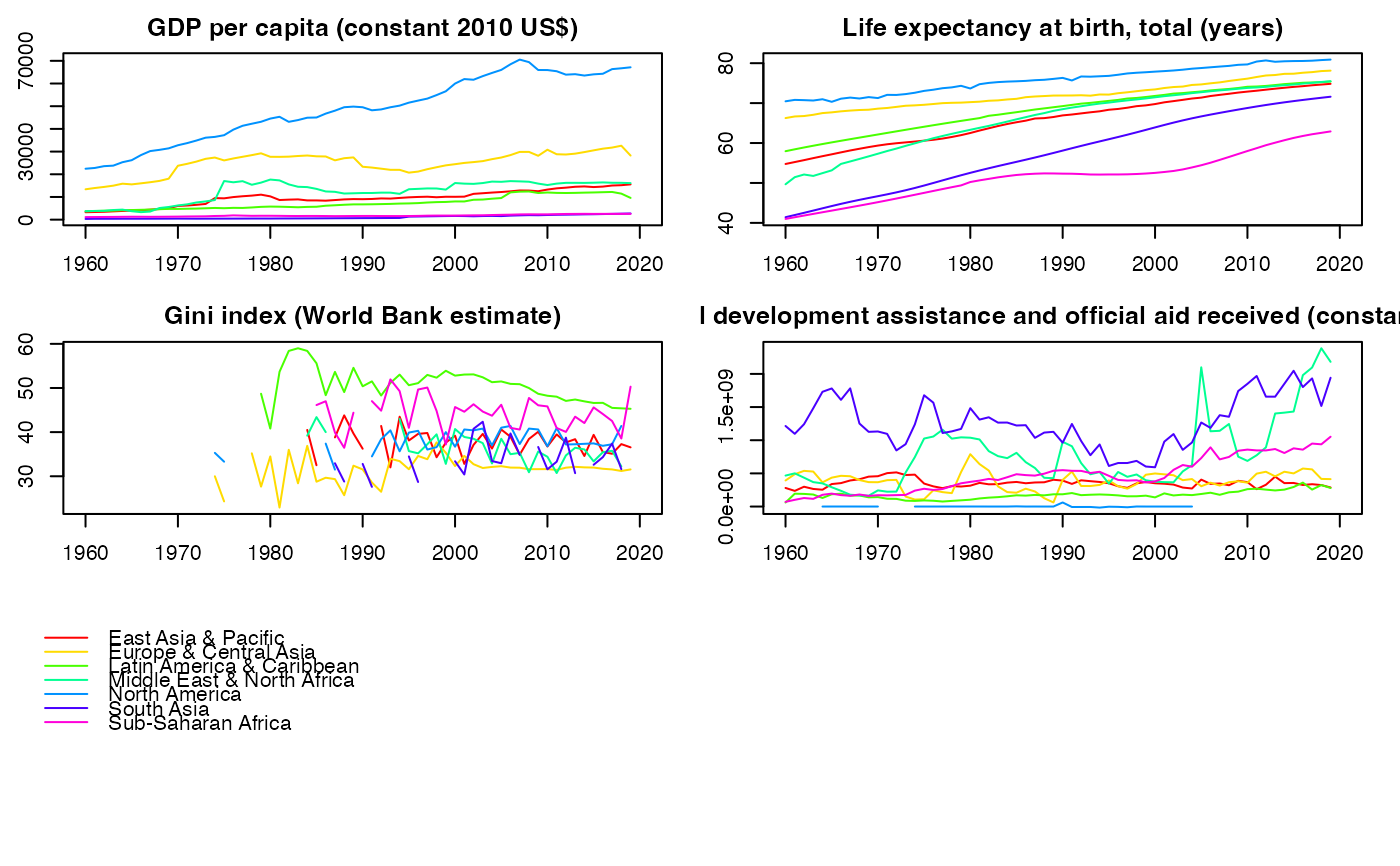
 plot(psmat(collap(wlddev, ~region+year, cols = 9:12), # More legible and fancy plot
~region, ~year), legend = TRUE,
labs = vlabels(wlddev)[9:12])
plot(psmat(collap(wlddev, ~region+year, cols = 9:12), # More legible and fancy plot
~region, ~year), legend = TRUE,
labs = vlabels(wlddev)[9:12])
 psml <- psmat(wlddev, ~ iso3c, ~ year, 9:12, array = FALSE) # This gives list of ps-matrices
head(unlist2d(psml, "Variable", "Country", id.factor = TRUE),2) # Using unlist2d, can generate DF
#> Variable Country 1960 1961 1962 1963 1964 1965 1966 1967 1968 1969 1970 1971
#> 1 PCGDP ABW NA NA NA NA NA NA NA NA NA NA NA NA
#> 1972 1973 1974 1975 1976 1977 1978 1979 1980 1981 1982 1983 1984 1985
#> 1 NA NA NA NA NA NA NA NA NA NA NA NA NA NA
#> 1986 1987 1988 1989 1990 1991 1992 1993
#> 1 15669.62 18427.61 22134.02 24837.95 25357.79 26329.31 26401.97 26663.21
#> 1994 1995 1996 1997 1998 1999 2000 2001 2002
#> 1 27272.31 26705.18 26087.78 27190.5 27151.92 26954.4 28417.38 26966.05 25508.3
#> 2003 2004 2005 2006 2007 2008 2009 2010 2011
#> 1 25469.29 27005.53 26979.89 27046.22 27427.58 27365.93 24463.69 23512.6 24233
#> 2012 2013 2014 2015 2016 2017 2018 2019 2020
#> 1 23781.26 24635.76 24563.23 25822.25 26231.03 26630.21 NA NA NA
#> [ reached 'max' / getOption("max.print") -- omitted 1 rows ]
## Indexing simplifies things
wldi <- findex_by(wlddev, iso3c, year) # Creating an indexed frame
PCGDP <- wldi$PCGDP # An indexed_series of GDP per Capita
head(psmat(PCGDP), 2) # Same as above, more parsimonious
#> 1960 1961 1962 1963 1964 1965 1966 1967 1968 1969 1970 1971 1972 1973 1974
#> ABW NA NA NA NA NA NA NA NA NA NA NA NA NA NA NA
#> 1975 1976 1977 1978 1979 1980 1981 1982 1983 1984 1985 1986 1987 1988
#> ABW NA NA NA NA NA NA NA NA NA NA NA 15670 18428 22134
#> 1989 1990 1991 1992 1993 1994 1995 1996 1997 1998 1999 2000
#> ABW 24838 25358 26329 26402 26663 27272 26705 26088 27191 27152 26954 28417
#> 2001 2002 2003 2004 2005 2006 2007 2008 2009 2010 2011 2012
#> ABW 26966 25508 25469 27006 26980 27046 27428 27366 24464 23513 24233 23781
#> 2013 2014 2015 2016 2017 2018 2019 2020
#> ABW 24636 24563 25822 26231 26630 NA NA NA
#> [ reached 'max' / getOption("max.print") -- omitted 1 row ]
plot(psmat(PCGDP))
psml <- psmat(wlddev, ~ iso3c, ~ year, 9:12, array = FALSE) # This gives list of ps-matrices
head(unlist2d(psml, "Variable", "Country", id.factor = TRUE),2) # Using unlist2d, can generate DF
#> Variable Country 1960 1961 1962 1963 1964 1965 1966 1967 1968 1969 1970 1971
#> 1 PCGDP ABW NA NA NA NA NA NA NA NA NA NA NA NA
#> 1972 1973 1974 1975 1976 1977 1978 1979 1980 1981 1982 1983 1984 1985
#> 1 NA NA NA NA NA NA NA NA NA NA NA NA NA NA
#> 1986 1987 1988 1989 1990 1991 1992 1993
#> 1 15669.62 18427.61 22134.02 24837.95 25357.79 26329.31 26401.97 26663.21
#> 1994 1995 1996 1997 1998 1999 2000 2001 2002
#> 1 27272.31 26705.18 26087.78 27190.5 27151.92 26954.4 28417.38 26966.05 25508.3
#> 2003 2004 2005 2006 2007 2008 2009 2010 2011
#> 1 25469.29 27005.53 26979.89 27046.22 27427.58 27365.93 24463.69 23512.6 24233
#> 2012 2013 2014 2015 2016 2017 2018 2019 2020
#> 1 23781.26 24635.76 24563.23 25822.25 26231.03 26630.21 NA NA NA
#> [ reached 'max' / getOption("max.print") -- omitted 1 rows ]
## Indexing simplifies things
wldi <- findex_by(wlddev, iso3c, year) # Creating an indexed frame
PCGDP <- wldi$PCGDP # An indexed_series of GDP per Capita
head(psmat(PCGDP), 2) # Same as above, more parsimonious
#> 1960 1961 1962 1963 1964 1965 1966 1967 1968 1969 1970 1971 1972 1973 1974
#> ABW NA NA NA NA NA NA NA NA NA NA NA NA NA NA NA
#> 1975 1976 1977 1978 1979 1980 1981 1982 1983 1984 1985 1986 1987 1988
#> ABW NA NA NA NA NA NA NA NA NA NA NA 15670 18428 22134
#> 1989 1990 1991 1992 1993 1994 1995 1996 1997 1998 1999 2000
#> ABW 24838 25358 26329 26402 26663 27272 26705 26088 27191 27152 26954 28417
#> 2001 2002 2003 2004 2005 2006 2007 2008 2009 2010 2011 2012
#> ABW 26966 25508 25469 27006 26980 27046 27428 27366 24464 23513 24233 23781
#> 2013 2014 2015 2016 2017 2018 2019 2020
#> ABW 24636 24563 25822 26231 26630 NA NA NA
#> [ reached 'max' / getOption("max.print") -- omitted 1 row ]
plot(psmat(PCGDP))
 plot(psmat(wldi[9:12]))
 plot(psmat(G(wldi[9:12]))) # Here plotting panel-growth rates
